

Everyone calls it “ranking volatility.” That framing is already making you lose. It’s not volatility. It’s a live recalculation engine running 500–600 updates a year — and most of those signals are things you can actually influence, if you stop staring at the dashboard and start reading the system.
The Wrong Definition Everyone Starts With
“My rankings are fluctuating” is the most dangerous sentence in SEO — not because it’s wrong, but because the frame it creates makes the right response almost impossible.
When you say “fluctuating,” you imply randomness. Something coming and going. Weather. You wait for it to pass. You check the tools obsessively every morning, refreshing Semrush Sensor like it’s a stock ticker, and you either panic or sigh with relief depending on whether today’s number is up or down. Neither response is useful.
Here’s the definition I want you to replace it with: Google rankings are a live competitive auction running across a set of weighted signals that is recalibrated between 500 and 600 times per year. Not randomly. Not capriciously. According to logic you can partly reverse-engineer, though you’ll never get the full formula and that’s intentional.
That reframe changes everything about how you respond. An auction has rules. Rules can be studied. Studied rules can be worked with.
Let me tell you the anecdote that cracked this open for me — and then I’ll show you the system underneath it.
In the spring of 2025, I was watching a client’s review aggregator page. It had ranked between positions 3 and 5 for a competitive informational keyword for fourteen months without moving more than two spots in either direction. Then, over a single weekend, it dropped to position 22. No changes to the page. No penalty notification in Search Console. No new manual action. Just — gone.
The instinct was to start editing. Add content. Build links. “Fix” something. But nothing was broken. What had happened was that a competitor published a significantly updated version of their competing page, Google’s crawlers processed it, the algorithm reweighted the comparison, and the client’s page lost the comparison. The page didn’t get worse. The competitive floor rose above it.
That’s the pattern. And in 2026, that pattern is running faster, with higher stakes, and with a new layer of AI evaluation that most SEOs still don’t fully account for.
Anatomy of a Daily Fluctuation (What’s Actually Happening Under the Hood)
Google’s own Guide to Google Search Ranking Systems lists more than a dozen distinct named systems: RankBrain, BERT, MUM, Neural Matching, PageRank, freshness systems, helpful content systems, link analysis systems, spam classifiers, and more. Each of these doesn’t run on a single toggle. They run simultaneously, they have different update cadences, and they interact.
When a “ranking fluctuation” shows up in your rank tracker, one or more of the following things has actually occurred:
- A signal weight has been adjusted — a broad core update re-weights how much a given signal (say, topical authority vs. pure backlink count) contributes to the final ranking calculation
- The competitive comparison changed — a competitor published, updated, or improved their page, and Google’s system re-ran the comparison and they won
- A freshness signal fired — Google’s Query Deserves Freshness (QDF) system detected that user intent on this query is now time-sensitive, and it boosted fresher pages
- A SERP layout changed — an AI Overview, a featured snippet, a video carousel, or a local pack appeared above your result, pushing it down the visible page without your actual position moving
- Google ran a bucket test — Google constantly A/B tests ranking arrangements across small slices of users; your site may enter or exit a test window
- A data refresh processed — link graphs, crawl data, and behavioral signals are not processed in real time; when a batch processes, positions recalculate
The important thing this diagram illustrates: the same rank drop can have six different root causes, and the correct response is different for each one. A signal-weight adjustment during a core update requires patience. A competitive page improvement requires content work. A QDF trigger requires a freshness response. A SERP layout change may not require anything — you may still be getting the same impressions, just from a lower position on a more crowded page.
The Six Forces Driving Daily SERP Movement in 2026
I want to be specific here, because most articles on this topic stay at 30,000 feet. “Google makes thousands of changes a year” is true but operationally useless. Let’s get closer to the machine.
Force 1: Overlapping Core Update Cycles
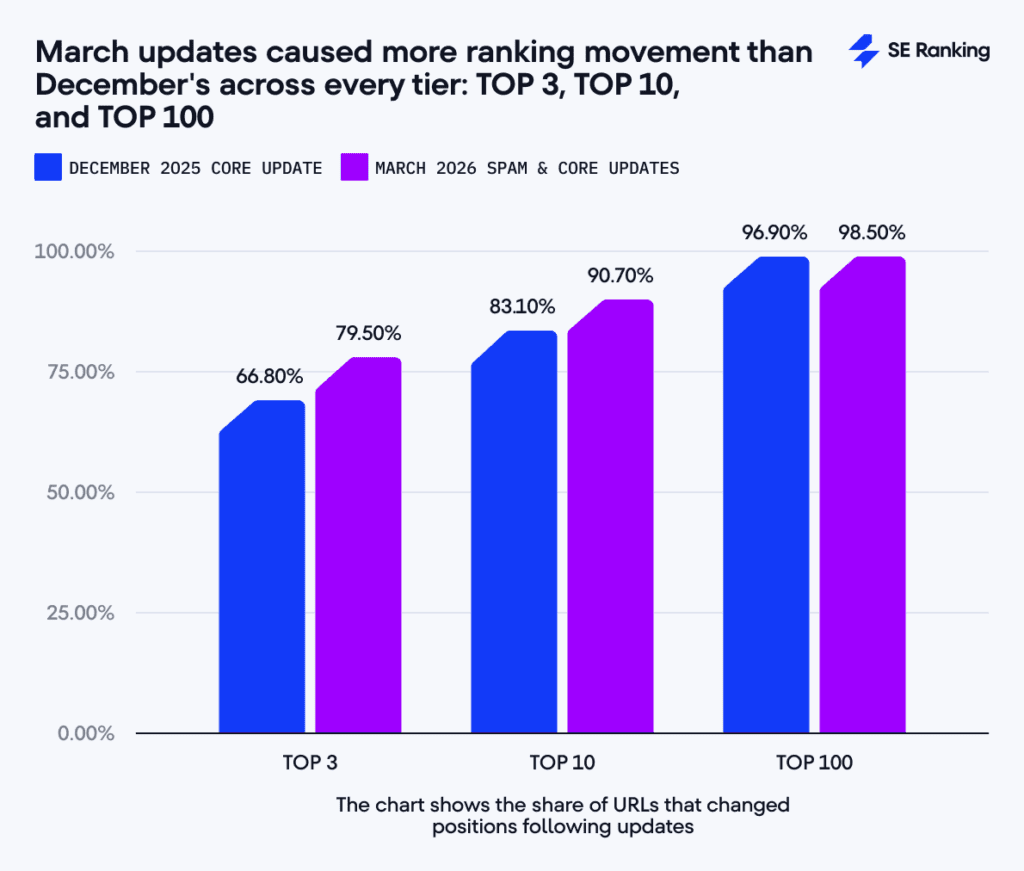
The 2026 update calendar has been genuinely unprecedented. The December 2025 core update ran from December 11 to December 29, 2025. Before rankings could fully stabilize, the February 2026 Google Discover Core Update began rolling out on February 5, 2026 — notably, the first ever core update targeting Google Discover specifically rather than web search broadly. That ran for 22 days, completing February 27. The March 2026 Core Update launched on March 27. The May 2026 Core Update followed on May 21, before March was even a distant memory for many sites.
The practical effect: sites experiencing losses from the December update had not finished recovering when they entered the February update window. Sites trying to diagnose March impact were hit by May before their data could stabilize. This is not Google being malicious. It reflects a structural shift toward continuous smaller updates rather than rare large events — something Google’s own Search Status Dashboard reflects in its increasingly granular incident logging.
Force 2: AI-Powered Ranking System Recalibrations
Google’s ranking systems — RankBrain, MUM, BERT, Neural Matching — are not static classifiers. They are trained systems that evolve. When Google updates the models underlying these systems, even without announcing a “core update,” the way content is evaluated shifts. A page that was “clearly the best match” for a query under an older model version may be reclassified when the model improves its understanding of intent. This is partly why Google’s John Mueller has repeatedly confirmed that most daily ranking fluctuations are part of normal operation — not targeted actions against specific sites. The system is genuinely improving all the time, and improvement means change.
Force 3: The AI-Generated Content Flood
Semrush estimated in 2025 that 17.3% of content in Google results is AI-generated. That number is almost certainly higher now. The practical effect on your rankings: your competitors are publishing at a volume and velocity that wasn’t economically feasible two years ago. A page that held position 2 for “best [X] for small business” in 2024 may now face six new competing pages published in the past three months, all targeting the same query with reasonable structure and decent on-page signals. The competitive density of most queries has increased dramatically. Your page didn’t get worse. The floor of what “good enough to rank” looks like got higher.
Force 4: Behavioral Signal Feedback Loops
Google continuously evaluates how users interact with SERP results. When users click your result and quickly return to the SERP (pogo-sticking), that is a quality signal. When users click a competitor’s result and stay for eight minutes, that is also a quality signal. These signals are not processed in real-time, but they do batch-process and influence rankings. This means rankings shift in response to user behavior — and user behavior shifts seasonally, topically, and in response to news cycles. A page that perfectly satisfied user intent in October may no longer satisfy it in June because what users want when they search that query has changed.
Force 5: Link Graph Reprocessing
PageRank is not calculated in real time. Google processes link data in batches, and when a batch processes, link equity calculations across your entire site update simultaneously. This can cause positions to shift even when nothing on your page changed. Additionally, competitor link acquisition — even slow, organic link building — continuously shifts the relative link-authority comparison. If your main competitor builds three solid links to a competing page while your page’s link profile sits still, the gap narrows and eventually flips.
Force 6: SERP Feature Cannibalization
This is the one that many site owners entirely miss. You can hold position 3 and lose 40% of your clicks if Google inserts an AI Overview, a featured snippet, a People Also Ask expansion, and a video carousel above the organic blue links. The rank tracking tool shows “stable.” Analytics shows catastrophic. The disconnect is real and increasing as AI Overviews expand across more query types.
The QDF Effect: When Freshness Overrides Authority
Query Deserves Freshness is one of Google’s most misunderstood systems — and it’s one of the most exploitable if you understand it precisely. Google’s own documentation confirms the existence of “query deserves freshness” systems designed to show fresher content where expected — it’s not a secret, just poorly explained in most SEO writing.
Here’s what it actually does. When Google detects that search volume for a query cluster has increased by roughly 3–5× or more from its baseline within a short window (hours to a day), it temporarily increases the weight of the recency signal for that query cluster. Fresh pages can jump above pages with dramatically stronger authority profiles. A site with 4,000 referring domains can find itself outranked by a three-month-old page with 60 — if that newer page has a recent publish date and covers the trending angle.
QDF operates across three primary trigger categories:
- Breaking news events — queries with essentially zero historical volume that spike suddenly (product launches, company announcements, incidents)
- Hot topic queries — recurring topics where a recent development makes the existing top results incomplete or misleading (regulatory changes, research publications, industry shifts)
- Recurring seasonal events — Google has modeled which queries predictably demand fresher content at specific calendar periods
The practical implication for SERP Feature Hacking: if your niche has any QDF-sensitive queries (check by searching your target keyword and looking at publication dates of Page 1 results — if multiple results are from the past week on a topic that’s been around for years, QDF is likely active), your freshness discipline matters as much as your authority profile.
If your People Also Ask boxes for a target query include time-markers (“What happened to [topic] in 2026?”, “What is the latest on [topic]?”), Google has classified that query cluster as freshness-relevant. Your publication date and your last significant update date are both active ranking signals in this context.
The AI Overviews Blindspot: You’re Ranking and Losing
This is the part that keeps me up at night, genuinely. Because it’s the scenario where all the traditional metrics say everything is fine, and the business is suffering.
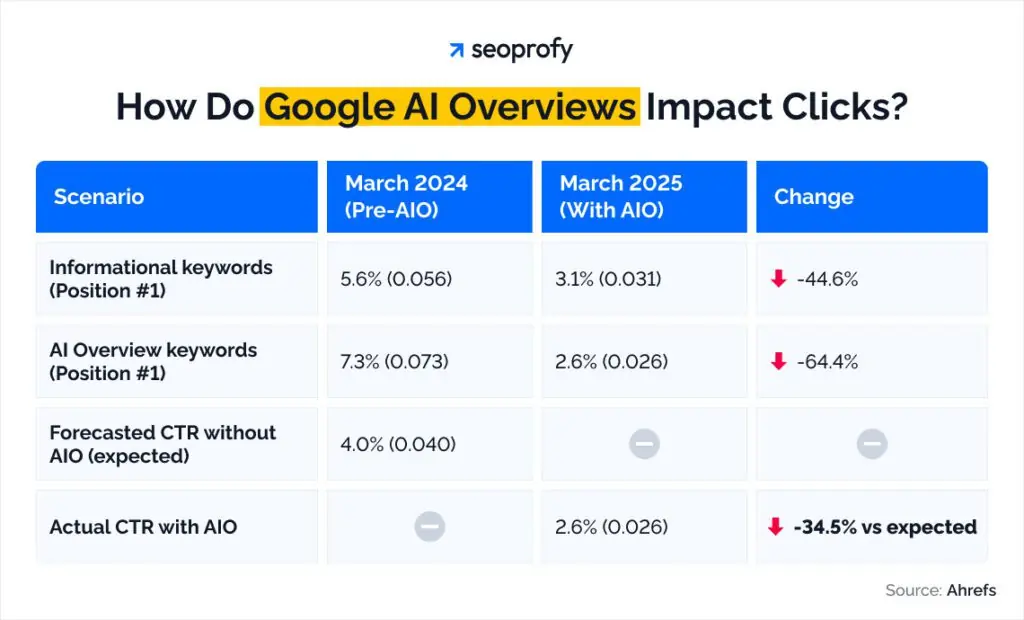
AI Overviews — Google’s generative AI results that appear above the organic blue links — are now expanding across a much wider range of informational queries than when they launched. The critical thing to understand is the decoupling that’s occurring:
Scenario A (what used to happen): You rank #2. You get ~15–20% of clicks for that query. Life is comprehensible.
Scenario B (what’s happening in 2026): You rank #2. Google’s AI Overview appears above all organic results, answers the query directly, cites three sources (which may or may not include you), and 60% of users never scroll past it. You still rank #2 in every rank tracker. Your clicks are down 40%. Your rank tracker shows green.
This “invisible redistribution” of clicks is the most underdiagnosed cause of traffic decline in 2026. Your ranking held. Your visibility changed. The difference between the two is now significant enough to represent material revenue impact for many businesses.
The SERP Feature Hacking angle here: getting cited in AI Overviews is a different optimization target than ranking #1 organically. Google’s AI citation system draws heavily from pages that are structured, clearly sourced, have defined entities, and use markup that makes information extractable. Structured data, clear paragraph-level answers to specific questions, and content that is “citable” rather than just “readable” are the differentiating factors.
The Volatility Diagnosis Matrix (Original Framework)
Most frameworks for handling ranking volatility tell you what to do. Almost none tell you which type of volatility you actually have before you start doing things. That’s backwards. The correct move during a core update and the correct move during a competitive content improvement are almost opposite.
I’ve been using what I call the CAUSE Matrix to triage ranking drops. It has saved me from making wrong moves on multiple occasions.
The CAUSE Matrix — Volatility Diagnosis Framework
Step 1: Determine the volatility type before determining the response. Each type has a different action profile.
Your position held industry-wide, but a specific competitor improved. Check their page’s recent updates. Response: content gap analysis, update your page.
Broad movement across many sites and sectors simultaneously. Check volatility trackers. Response: wait for stabilisation before analysing. Do not make major changes mid-rollout.
Your page’s engagement dropped (higher bounce, lower dwell). User intent may have evolved. Response: refresh the page to match current intent, improve above-the-fold satisfaction.
Your position is stable, but clicks fell. An AI Overview, featured snippet or layout change pushed your result down. Response: optimise for citation in new SERP features, not for position.
Drop is sudden and deep (> 50 positions), not correlated with other sites. Check Search Console for coverage errors, noindex issues, canonical problems. Response: technical audit first.
Use SEMrush Sensor, Mozcast, and Google Search Console simultaneously to distinguish A (broad) from C/U/E (site-specific). If every site in your niche moved — it’s A. If only you moved — start at C, U, or E.
Quantitative Reality Check: What Does a Rank Drop Actually Cost?
I’m going to walk through a real-looking calculation, because most articles on this topic stay entirely qualitative. I want to give you the arithmetic, with assumptions stated clearly, so you can apply it to your own situation.
Scenario: Dropping from Position 3 to Position 8
Query monthly search volume: 8,000 (moderate commercial informational)
Standard CTR at Position 3: ~10% (industry consensus range: 8–15%)
Standard CTR at Position 8: ~2.5% (industry consensus range: 1.5–4%)
Site conversion rate from organic: 2.1%
Average order/lead value: $85
AI Overview present: assumed absent for simplicity (with AOV: multiply CTRs by ~0.6)
| Metric | Position 3 | Position 8 | Delta |
|---|---|---|---|
| Monthly impressions | 8,000 | 8,000 | — |
| Monthly organic clicks | 800 | 200 | −600 clicks |
| Monthly conversions | 16.8 | 4.2 | −12.6 conversions |
| Monthly revenue impact | $1,428 | $357 | −$1,071/mo |
| Annualized revenue impact | $17,136 | $4,284 | −$12,852/yr |
On a moderate-volume keyword with a modest conversion rate, a single five-position drop costs roughly $12,852 per year in direct revenue. That’s before accounting for compounding effects: lower organic traffic means less behavioral data flowing back to Google, which can make recovery slower. It also means less branded exposure, fewer return visitors, and reduced email list growth from organic acquisition.
The Compounding Volatility Cost Model
Here’s the quantitative insight that almost no one talks about: ranking volatility itself has a cost beyond the revenue loss of any individual drop.
When rankings fluctuate, you face:
- Decision paralysis cost: Editorial and development resources get diverted to monitoring and analysis rather than content creation — estimated 4–8 hours per volatile week per site manager
- Panic-edit risk cost: Unnecessary page edits during volatility can reset crawl priority, break internal signals, and — as I’ll describe in my mistake section — actually worsen performance
- Forecasting degradation: When rankings are volatile, traffic projections become unreliable, which affects advertising budget planning, content ROI calculations, and hiring decisions
At $75/hour for a skilled SEO analyst, 6 hours of “volatility monitoring overhead” per week = $23,400/year in hidden labour costs on a single site — before any actual ranking change occurs. The volatility itself is expensive.
My Honest Mistake: The Panic-Edit Trap
In February 2025, during a period of elevated SERP volatility, I pushed a series of what I thought were “improvement edits” to a high-performing pillar article on a client’s site. The page had dropped from position 4 to position 9 over three days. I changed the title tag, restructured the H2 hierarchy, added three new subsections, and updated the publish date.
The page didn’t recover. It dropped to position 14. It stayed there for six weeks — longer than any unedited page in the same drop wave. Why? The edits reset Google’s crawl evaluation window for the page. The page was re-assessed while the update was still rolling out, got caught in mid-update scoring, and the new evaluation was worse than the original. By the time the update stabilised, the page was being judged on its modified version, which I had changed hastily, not on the version that had earned position 4.
I have since made it a strict rule: no significant page edits during confirmed or likely update rollout windows. Monitor. Document. Queue the changes. Execute after the tracker readings return to baseline for at least 7 days.
SERP Feature Hacking Response Protocol: The DART System
This is the framework I now use for every ranking movement of more than 5 positions on a high-value page. It’s designed to separate diagnosis from action — which is the main failure mode I see in how sites respond to volatility.
The DART System — SERP Feature Hacking Response Protocol
Check: which pages moved? Which keywords? Desktop vs mobile split? Is this site-wide or page-specific? Consult SEMrush Sensor / Mozcast simultaneously.
Is this Competitive / Algorithmic / User Signal / SERP Structural / Entity-Technical? Each type has a different action profile. Do not skip this step.
Are there new SERP features? Who is now #1? When was their page last updated? What’s different about the content format? Are AI Overviews appearing?
If type = Algorithmic: wait minimum 14 days post-confirmed completion. If type = Competitive: begin gap analysis now, publish the update after the rollout window ends.
The DART System’s core principle: the correct response to most ranking volatility is structured observation, not immediate intervention. The sites that recover fastest are usually the ones that changed nothing during the rollout and responded precisely afterward.
When to Act Immediately (The Exceptions)
The time-gating principle has two hard exceptions where waiting is wrong:
- Technical Emergency: If Search Console shows a sudden spike in Crawl Errors, a page previously indexed is now returning 404, or a noindex tag has been accidentally introduced — act within hours, not weeks. This is not volatility. This is a technical failure.
- QDF Window: If you’ve confirmed via the SERP that your query is in an active QDF window (fresh pages are dominating results for a topic with strong historical content) and you have genuinely new information to add — the window won’t wait. Publish the updated version. QDF windows can close in days.
The Unpopular Take
Most of the SEO industry’s response to ranking volatility is, charitably, a displacement activity. Not because the advice is wrong, but because it targets the visible symptom (rankings moved) rather than the actual problem (the site’s content has no permanent competitive advantage).
Here is the take I know will annoy half the people reading this: most sites that experience severe, recurring ranking volatility deserve to. Not as punishment. Not because Google is capricious. But because the pages that got hit were, on balance, competitive by degree rather than genuinely irreplaceable.
Think about the sites you know that have been largely unaffected by the March 2026 Core Update, the May 2026 Core Update, the cascading volatility of Q1 2026. What do they have in common? They publish things nobody else publishes. They have real editorial voices. They cite primary research. Their authors have verifiable expertise and their bylines are findable humans, not brand names. Their content satisfies intent so completely that users don’t go back to the SERP.
The hard version of “what to do about ranking fluctuations” is: build a site that is genuinely better than competitors, not marginally optimised for the same signals they’re also optimising for. “Create helpful content” sounds like a platitude until you realise that most sites — including many technically sophisticated ones — have never actually stress-tested whether their content genuinely helps someone better than the next five results do.
If your ranking strategy consists primarily of keyword targeting, on-page optimisation, and link building — and does not include a mechanism for generating original insights, data, or perspectives that do not exist elsewhere — then you are building on sand. The 2026 update cycle is specifically designed to reward information gain. Pages that add nothing new are the intended targets.
48-Hour Action Sequence After a Drop
Theory is useful. Protocol is necessary. Here’s the exact sequence I run when a priority page drops by more than 5 positions:
-
Hours 0–2: Establish the baseline. Pull Search Console data for the affected URL (28-day view vs. 7-day view). Identify: did impressions fall, or did clicks fall while impressions held? Falling impressions = possible indexing issue or SERP feature displacement. Falling clicks with stable impressions = CTR problem (often SERP feature insertion).
-
Hours 2–4: Check the tools. Open SEMrush Sensor, Mozcast, and Accuranker’s Grump simultaneously. If readings are above 7/10 on SEMrush Sensor — you are in an update window. Enter time-gate mode. Do not edit the page.
-
Hours 4–6: Manual SERP audit. Search your top 3 affected keywords in an incognito browser. Document: (a) who is now ranking above you, (b) what SERP features are present, (c) when those pages were last updated, (d) whether AI Overviews appear and what sources they cite.
-
Hours 6–12: Technical health check. Run a crawl of the affected URLs via Screaming Frog or Ahrefs Site Audit. Check for: accidental noindex, canonical conflicts, slow page speed (CrUX data in Search Console), structured data errors. If any of these are present — this is a separate issue from the ranking drop and should be fixed immediately regardless of update status.
-
Hours 12–48: Competitive content audit. Visit every page now ranking above yours. Create a comparison spreadsheet: word count, heading structure, media types used, schema markup present, publication date, last updated date, number of outbound links to primary sources, author attribution. This becomes the brief for your page’s next update — queued for after the volatility window closes.
-
Day 7+: Re-evaluate. Check if the drop has stabilised or continued. If volatility trackers have returned to baseline and your drop is holding — this is the signal that the change is real and requires a content response. Execute the update from step 5 now.
Google Search Console (free, essential) · SEMrush Sensor (free tier) · Mozcast (free, daily temperature reading) · Google Ranking Systems Guide (primary source) · Google Search Status Dashboard (confirmed update calendar)
The Three Quantitative Takeaways
| Finding | Figure | Implication |
|---|---|---|
| P3 → P5 position drop on 8K MSV query | −$561/month | A 2-position drop on one keyword is a material business loss, not a metric blip |
| AI Overview CTR reduction (estimated) | ~40% CTR drop | Optimise for AI Overview citation, not just position — or accept ongoing traffic erosion |
| Google algorithm updates per year (SEO.com, 2026) | 500–600/yr | Expecting ranking stability is structurally impossible; build for resilience, not stability |
| Sites seeing 20–35% organic traffic swings (Q1 2026) | Industry-wide | Confirmed by ALM Corp analysis of multiple tracking tools; not isolated to specific niches |
| Volatility overhead cost (skilled analyst) | ~$23K/yr | 6 hrs/week × $75/hr × 52 weeks. Resilience investment pays back faster than expected. |
What Actually Stabilises Rankings in 2026
After everything above, you might want a tidy checklist. I’ll give you one, but I want to say something first: the checklist is downstream of a mindset shift. The mindset shift is this: stop trying to stabilise your rankings. Start trying to earn them beyond dispute.
The sites that held through every wave of 2026 volatility — the March update, the May update, the unconfirmed January spikes — share a small number of characteristics that have nothing to do with keyword density or backlink velocity. They publish things that genuinely cannot be found elsewhere. They update content before Google has to flag it as stale. They have author pages with real humans behind them. Their content satisfies user intent so completely that the bounce rate is structurally low, not because they’ve manipulated session duration, but because they answered the question.
Use Content Evaluator to stress-test your articles against these standards before you publish. Check your content quality framework regularly. The zero-click era covered in the rise of zero-click content analysis is exactly where the AI Overview blindspot connects: optimise for being cited, not just for ranking.
The practical actions:
- Audit your top 20 pages for information gain — what does your page say that the next five search results don’t?
- Add clear entity markup (schema.org) to every article: Author, Article, FAQPage where applicable. Make yourself citable by AI systems.
- Establish a freshness discipline: review and meaningfully update every article that’s 12+ months old. Not just the date — the content.
- Set up a SERP monitoring protocol: check your top 50 keywords manually once a month. Look for new SERP features. Don’t outsource all of this to tools.
- Build a content brief that includes a “why us” test: before writing any page, document one specific thing this page will say that nothing else in the top 10 currently says. If you can’t answer that, you don’t have a topic — you have a copy of someone else’s answer.
The friction is that “genuinely worth ranking” is harder than it sounds, takes longer than you want, and doesn’t show up in rank trackers for weeks after you do the work. That gap between action and result is where most sites break. The ones that don’t — those are the ones still in position 1 six months from now, treating this whole volatility conversation as background noise.