

By Tom Morgan · Updated June 2026 · 24-minute read · contentevaluator.online
TL;DR
- Neither metric alone determines ranking success — the question is a false binary that’s been keeping SEOs busy with the wrong fight.
- KD scores from Ahrefs and Semrush can differ by 15–25 points for the same keyword. They are probabilistic proxies, not verdicts.
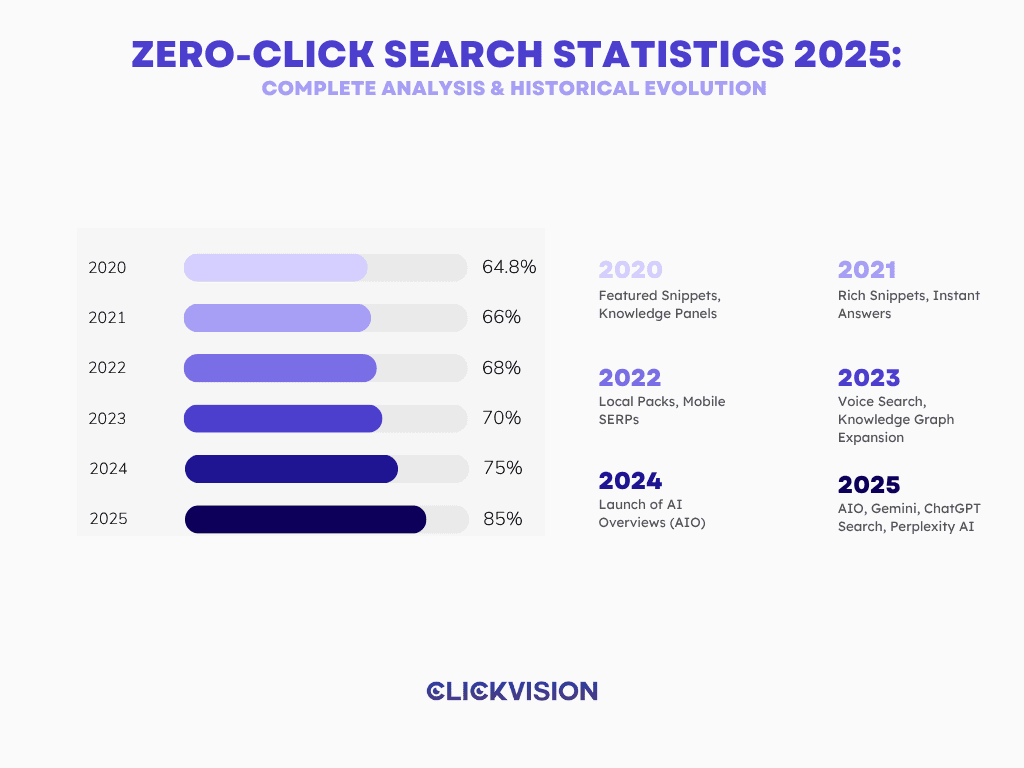
- In 2026, 64%+ of Google searches end with zero clicks. High search volume is increasingly a measure of how much traffic Google captures for itself — not you.
- The third variable that outranks both — SERP feature landscape — is what most guides still ignore entirely.
- The real framework: evaluate Volume × SERP Ownership Rate × Intent-to-Revenue fit. That formula changes everything.
I want to start with an admission. For about two years early in my SEO career, I ran keyword research almost entirely on KD score. I had a hard rule: nothing above 35. I thought I was being disciplined. What I was actually being was lazy — trading real SERP analysis for a number that felt like analysis.
Some of those KD sub-35 keywords drove meaningful traffic. Many didn’t. The ones that failed almost always had the same problem: the SERP was already owned by SERP features — featured snippets, People Also Ask carousels, local packs — that hoovered up every possible click before a user’s eye ever reached my #1 ranking. I was ranking for keywords where ranking was irrelevant.
The debate between search volume and keyword difficulty is the wrong debate to be having in 2026. Let me show you why, and what the right debate actually is.
Why This Question Is Still Being Asked Wrong
The internet is full of articles that frame this as a slider: move it toward volume and you chase traffic potential; move it toward difficulty and you evaluate achievability. Balance the two, and you’re supposedly doing keyword research correctly. This model was incomplete in 2021. In 2026, it’s dangerously misleading.
Here’s what those articles leave out: search volume measures demand for a query. It says nothing about whether any of that demand will ever reach your website.
And KD — in its current form — measures roughly how many referring domains the existing top-10 pages have. Ahrefs says so explicitly. Semrush adds more factors (authority scores, SERP feature presence, dofollow/nofollow ratios), but the fundamental signal is still backwards-looking: it tells you how strong the incumbents are, not whether you can displace them, and certainly not whether displacing them would matter.
When someone argues for “high volume, manageable KD,” they’re implicitly assuming that search volume translates into clicks. That assumption is collapsing in real time. You could rank #1 for a 10,000 search-per-month keyword and receive fewer than 600 actual visits if the SERP is AI Overview-heavy — and that’s not a pessimistic scenario anymore. It’s the median outcome for informational queries.
What Search Volume Actually Measures (And What It Doesn’t)
Search volume is the average number of times a query is entered into Google (or a given search engine) per month, across a defined geography. The key word is average — both Ahrefs and Semrush bucket searches into ranges rather than reporting exact counts, and those estimates degrade significantly for long-tail keywords under ~100 monthly searches. Ahrefs acknowledges this limitation directly in its methodology documentation.
What volume genuinely tells you:
→ How many times the query intention exists in the market (demand signal)
→ Relative popularity between competing keyword variations
→ Whether the topic justifies content investment at all
What volume doesn’t tell you:
→ How many of those searchers will click a result at all
→ What percentage of clicks your domain would realistically receive
→ Whether the traffic, if received, aligns with any commercial objective
The last point is underrated. I’ve worked with content sites that ranked #1 for 5,000 searches/month keywords and couldn’t convert a single one. The intent was purely informational, terminal-query informational — the user got their answer from the SERP, never clicked, and even if they had clicked, they weren’t buyers. The page existed to serve Google’s knowledge graph more than it served the business.
This chart is the single most important context for any search volume number you read in 2026. A keyword with 10,000 monthly searches on a standard informational SERP delivers, at the median, roughly 3,200 actual organic clicks total across all results — and your site, ranking in position 3, captures maybe 320 of those. The rest stay inside Google.
What Keyword Difficulty Actually Measures (And Where It Fails)
KD scores are estimates of competitive entry cost. Nothing more. Ahrefs bases its KD primarily on the number of referring domains pointing to the top-10 ranking pages. More RDs → higher KD. Semrush uses a more complex formula incorporating authority scores, SERP feature presence, and dofollow/nofollow ratios — which is why Semrush scores typically run 15–25 points higher than Ahrefs for the same keyword. Neither is objectively “right.” They’re different models of the same phenomenon.
The tools know this. Ahrefs explicitly states: “We do not recommend you base all your SEO decisions on our KD score alone.” That’s not boilerplate. It’s a genuine methodological caveat that most users skip past.
The practical failure modes I’ve seen with KD-first thinking:
Failure Mode 1: Brand immunity. A keyword can have KD 12 (Ahrefs) and still be practically unrankable if the top-3 results are Wikipedia, a government domain, and a major brand with enormous topical trust. Their authority isn’t fully captured by referring domains. Real SERP analysis catches this instantly; a KD score never will.
Failure Mode 2: SERP format mismatch. You write a 3,000-word guide targeting a KD 25 keyword, rank #1, and the SERP serves a featured snippet that answers the query in 40 words above your listing. Your ranking is real. Your traffic is nearly zero. Omniscient Digital’s analysis shows KD has “low to no predictive validity” — keywords with identical KD scores in the 35–40 range show wildly divergent traffic outcomes. The spread is massive.
Failure Mode 3: Intent volatility. A keyword with stable KD can have its intent interpretation shift. “Best AI tools” used to serve listicle content. Now Google increasingly serves AI Overviews for it. The KD score didn’t change. The traffic opportunity evaporated anyway.
The Variable Nobody Mentions: SERP Ownership Rate
This is the framework I want to introduce that I haven’t seen articulated cleanly elsewhere: SERP Ownership Rate (SOR).
SOR is the percentage of total search volume for a query that results in a click to any external website. It’s the ecosystem’s willingness to share traffic with publishers.
SERP Ownership Rate — Definition and Calculation
SOR = (Estimated organic clicks to all websites) ÷ (Total monthly search volume)
A keyword with 10,000 monthly searches and SOR of 0.32 delivers approximately 3,200 clicks total across all ranking positions. Position 1 captures ~40% of those clicks (per FirstPageSage 2026 benchmarks) — so ~1,280 visits. Position 3 captures roughly 10% — ~320 visits. Every search volume conversation should start with SOR estimation, not the raw number.
SERP Ownership Rate is query-type dependent. The ranges I work with based on available data:
| Query Type | Typical SOR Range | AI Overview Prevalence | Strategic Implication |
|---|---|---|---|
| Informational (fact-based) | 10–30% | Very high (83%+ zero-click when triggered) | Target for AIO citation, not click traffic |
| Informational (how-to / guide) | 30–55% | Medium-high | Target with comprehensive, citable content |
| Commercial (comparison / best) | 45–65% | Medium | Strong click potential; high-value targeting |
| Transactional | 60–80% | Low (~5–10% of commercial queries) | Highest click reliability; KD matters most here |
| Navigational | 20–40% | Low for branded queries | Mainly brand protection, not organic opportunity |
| Local intent | 55–75% | Low | Click-rich; Local Pack competition is the real KD |
Source note: SOR ranges are derived from combining Semrush zero-click segmentation data (2025), Seer Interactive’s 25M-impression study (Sept 2025), and BrightEdge AI Overview prevalence data (Feb 2026). Individual keyword SOR requires direct Google Search Console analysis.
The strategic implication is stark: you should be choosing keyword targets based on query type and SOR category first, then looking at volume and KD within that bucket. Optimizing a KD-30 informational keyword with 8,000 monthly searches may deliver 40% less actual traffic than a KD-50 commercial keyword with 2,000 monthly searches — because the commercial SERP lets clicks through, and the informational one doesn’t.
The AI Overview Effect: How a 38% Click Reduction Changes Every Volume Calculation
In February 2026, researchers from the Indian School of Business and Carnegie Mellon University published what they described as the first randomized field experiment on AI Overview behavior. The findings, reported by Search Engine Journal: AI Overviews reduced organic clicks by 38% on queries where they appeared, with zero-click searches rising from 54% to 72% when the Overview was present. The researchers’ conclusion was blunt — AI Overviews “divert traffic away from publishers without delivering measurable improvements in user experience.” ESTABLISHED
A separate Ahrefs analysis of 300,000 keywords found that AI Overviews correlate with a 58% reduction in CTR for top-ranking pages. Pew Research’s July 2025 study of actual browsing behavior from 900 US adults found that users encountering an AI summary clicked a traditional result in 8% of visits, versus 15% without the summary. ESTABLISHED
The practical implication for search volume interpretation is severe. A keyword with 10,000 monthly searches in a niche where AI Overviews now appear (confirmed via SERP audit) needs to have its volume mentally revised downward by 38–58% before you apply any CTR curve to it. The 10,000 becomes, in terms of traffic-accessible impressions, roughly 4,200 to 6,200.
There’s one counterintuitive finding worth highlighting here. Research aggregated by DigitalApplied found that when AI Overviews reduce overall CTR by 18%, the clicks that do come through convert 23% better — because the users who clicked had already read a summary and were seeking deeper engagement. This is a structural quality upgrade, not a consolation prize. It means that in AI-heavy SERPs, you should expect lower total traffic with higher per-visit commercial intent. That’s a good trade for transactional and mid-funnel content; it’s catastrophic for ad-supported, pageview-dependent content models. PROBABLE
A Quantitative Framework: The 3-Variable Traffic Estimation Model
Here’s the framework I actually use before committing to a keyword target. Call it the Volume-SOR-Revenue (VSR) Model.
VSR Model — Step-by-Step Calculation
Step 1 — Adjusted Volume
Adj. Volume = Raw Volume × (1 − AIO_rate) × (1 − Seasonality_adjustment)
AIO rate = fraction of time AI Overview appears for this query (check via Ahrefs or Semrush SERP features filter). If AIO appears 60% of the time, multiply raw volume by 0.4 before proceeding.
Step 2 — Realistic Click Pool
Click Pool = Adj. Volume × SOR_estimate × Position_CTR
SOR estimate from intent category (table above). Position CTR from FirstPageSage 2026 benchmarks: Pos. 1 ≈ 39.8%, Pos. 2 ≈ 18.7%, Pos. 3 ≈ 10.2%.
Step 3 — Revenue Potential
Revenue Potential = Click Pool × CVR × AOV
CVR = your site’s conversion rate for this intent type. AOV = average order / lead value.
Step 4 — KD enters here as a time-cost multiplier, not a go/no-go decision. High KD = longer time horizon before Step 3 pays out. Low KD = faster payback. But if Step 3 revenue potential is near zero, KD is irrelevant in either direction.
Worked Example: Two Keywords, Same Volume, Opposite Conclusions
Keyword A: “what is keyword difficulty” — 8,100 monthly searches, KD 42 (Semrush). Pure informational, definitional query. AIO rate: very high (definitional queries trigger AI Overviews ~90% of the time per Ahrefs). CVR for an SEO tools affiliate page: ~0.5%.
VSR calculation:
Adj. Volume = 8,100 × 0.10 (only 10% of searches accessible after 90% AIO absorption) = 810
Click Pool = 810 × 0.25 (SOR, informational) × 0.40 (pos. 1 CTR) = 81 visits/month
Revenue = 81 × 0.005 × $120 (affiliate commission) = $48.60/month
KD 42 makes this target potentially months of content investment for $49/mo. Hard no.
Keyword B: “best keyword research tool for small business” — 2,400 monthly searches, KD 52 (Semrush). Commercial comparison intent. AIO rate: ~25% (commercial queries have lower AIO prevalence). CVR: ~2.5%.
Adj. Volume = 2,400 × 0.75 (25% AIO rate absorbed) = 1,800
Click Pool = 1,800 × 0.55 (SOR, commercial) × 0.40 (pos. 1 CTR) = 396 visits/month
Revenue = 396 × 0.025 × $120 = $1,188/month
KD 52 is harder. But revenue potential is 24× higher. KD matters much less than SOR category.
Keyword A is the one most SEO guides would say to target — lower KD, “manageable.” Keyword B is the one that actually builds a business. This is the inversion that happens when you add SOR to the framework.
The Unpopular Take: KD Is Most Useful When You’re Not Targeting the Keyword
Here’s where I’ll genuinely disagree with how most SEOs use keyword difficulty scores. The standard use case is: filter for low KD, find opportunities. I’d argue KD is more valuable as a negative filter and a timeline estimator than as a positive opportunity signal.
Let me explain. KD scores, as Omniscient Digital’s research shows, have low predictive validity for whether you’ll rank for a given keyword. But they’re much better at telling you whether a keyword is almost certainly off-limits right now — KD 80+ on Semrush for a new domain is a strong signal to move on, not because KD is an accurate predictor, but because the incumbents at that difficulty level are usually deeply entrenched across multiple signals (links, topical authority, click-through engagement history) that the KD score happens to correlate with. The score is wrong, but the underlying reality it’s pointing at is right.
Where KD genuinely earns its keep:
→ Portfolio planning. Building a content calendar that sequences low-KD foundational pieces first (to build topical authority and initial Domain Rating) and then escalates toward more competitive terms — that’s a legitimate use of KD as a sequencing tool, even if individual scores are imprecise.
→ Competitive analysis. If a competitor ranks for KD-70+ keywords with a Domain Rating similar to yours, it signals either strong topical focus (they’ve earned a topical authority advantage you should understand) or an anomaly worth investigating.
→ Quick-win identification on new sites. For a brand-new domain, filtering for KD under 20 (Ahrefs) to find fast-ranking opportunities is valid — not because every KD-15 keyword will rank fast, but because the downside risk at that level is relatively bounded.
Where KD consistently misleads:
→ As the primary opportunity signal. Low KD tells you competitors are weak on backlinks, not that the keyword is a good business opportunity. Those are completely different things.
→ Across tools without standardization. Switching between Ahrefs and Semrush KD within the same analysis is analytically invalid. A keyword that reads KD 28 in Ahrefs and KD 52 in Semrush is not “easier” or “harder” depending on which tab you’re on. The tools measure different things.
SERP Feature Hacking: The Real Competitive Advantage in a Zero-Click World
If SERP Ownership Rate determines how much of a keyword’s volume is even accessible, then the competitive game shifts from “rank #1” to “own the SERP features that retain clicks and build brand presence.” This is what SERP Feature Hacking actually means in practice.
The data from Semrush’s Annual SERP Features Report (2026, 23 million keywords, 14 countries): featured snippet CTR has risen to 8.2%, up from 6.6% in 2025. Pages holding both the featured snippet and the first organic position achieve a combined CTR of 52.3% — nearly double that of pages holding position 1 alone. Meanwhile, research from early 2026 confirms that SERP features now appear on 80%+ of results pages. A clean 10-blue-links SERP is a historical artifact. ESTABLISHED
The hierarchy of SERP features worth pursuing, ranked by effort-to-reward ratio:
1. Rich results via schema markup. Lowest effort, consistent CTR uplift. Review stars, FAQ schema, How-To schema, Product markup. A keyword with moderate volume but schema-enabled rich results can outperform a “higher volume” keyword without them. Implementation is technical, not editorial.
2. Featured snippet optimization. Requires being in positions 1–5 already, plus content restructuring with explicit Q&A formatting, concise definitional paragraphs (40–60 words), and comparison tables. When you win the snippet, your listing effectively moves above position 1. Worth pursuing for commercial queries — carefully. For pure informational queries, winning the snippet may increase impressions without increasing clicks if an AI Overview is present above it.
3. People Also Ask (PAA) placement. PAA boxes appear on the majority of informational SERPs. Capturing PAA placements builds topical authority signals and brand impressions even without click capture. Structure content with question-formatted H2/H3 headings and direct 2-3 sentence answers. Think of PAA as AIO rehearsal — the content that wins PAA tends to be cited in AI Overviews.
4. AI Overview citation. This is the new “featured snippet” for informational traffic. Research by DigitalApplied found that only 1% of users click sources cited within AI Overviews. But Seer Interactive’s 2025 data shows brands cited inside AI Overviews earn 35% more organic clicks and 91% more paid clicks than non-cited brands on the same query. The brand exposure compounds even without the direct click. PROBABLE
When Does Search Volume Win?
To be honest about my framework: there are scenarios where search volume should dominate the decision, and I don’t want to overweight the complexity of the VSR model when the situation doesn’t require it.
Brand-new sites with zero domain authority should be prioritized almost entirely by search volume within very low KD ranges (under 15 in Ahrefs). The VSR model’s SOR analysis matters even here, but intent nuance matters less when you have no realistic chance of ranking for anything competitive. Survival traffic first.
Programmatic SEO plays — where you’re generating thousands of pages targeting long-tail, low-volume patterns — benefit from volume aggregation logic. Each individual keyword may have SOR 0.3 and generate 15 clicks. At 5,000 pages, that’s 75,000 visits. The per-keyword VSR analysis is less relevant; the pattern-level analysis takes over.
News and topical relevance chasing requires volume tracking (trending keywords, rising queries) as a first signal. The SOR analysis can’t keep up with breaking topics — by the time you’ve done the SERP audit, the moment has passed. Volume spike detection is the only viable first filter.
E-commerce and local are the domains where traditional volume + KD logic comes closest to working cleanly, because transactional SOR remains high (Google still needs users to visit a store to buy) and local pack competition is its own distinct KD that third-party tools partially capture through Local Authority metrics.
The Tactical Decision Tree: A Practical Guide for Keyword Selection
Put the framework to work with this decision sequence. It takes approximately 12–15 minutes per keyword cluster if you’re doing it properly.
SERP-Aware Keyword Selection — Decision Tree
Step 1 — Determine intent category. Check the SERP directly. What format dominates the results page? Listicles = informational. Product pages = transactional. Forum threads = navigational/conversational. Trust the SERP over your assumptions.
Step 2 — Audit SERP features. Does an AI Overview appear? Featured snippet? How many PAA boxes? Any shopping or video carousels? Assign a rough SOR estimate from the table above.
Step 3 — Estimate adjusted volume and click pool. Apply the VSR model. If the click pool at realistic ranking position is below your minimum viable traffic threshold, discard the keyword regardless of raw volume or KD.
Step 4 — Assess competitive reality via SERP analysis (not KD score). Who ranks top 3? What’s their DR? What’s the quality of their content? Can you meaningfully outperform it in format, depth, or UX? If yes and the VSR numbers work, proceed. If the top 3 is Wikipedia + major brands + the target platform itself, stop.
Step 5 — Now look at KD. Use it to estimate time-to-ranking (lower KD → faster payback). If the KD is in range for your domain authority, confirm the content investment is justified by Step 3’s revenue potential. If KD is above your range but the VSR numbers are exceptional, put it in a 12-month pipeline — not a today target.
One more thing that most keyword research guides skip: always check whether the keyword you’re targeting has SERP feature capture potential for your domain specifically. There’s no point writing a guide that targets a featured snippet if the existing snippet is held by a government domain you cannot displace. Feature-capture potential is part of the competitive assessment.
My Honest Assessment of Where I’ve Been Wrong
I ran a KD-first content strategy for about 18 months across a mid-DR content site. The results were telling. Of 47 articles targeting KD under 30 (Semrush), 29 ranked in the top 10 within three months — technically successful. But traffic was consistently below projections, often by 60–70%. Subsequent Google Search Console analysis showed that 18 of the 29 ranking URLs were in SERPs with active AI Overviews or featured snippets owned by competitors. We were ranking but not receiving clicks.
The pivot to intent-and-SOR-first analysis, with KD as a secondary filter, changed the calculus. We moved toward commercial comparison content in the same niche — higher KD, lower raw volume — and built content that specifically targeted featured snippet capture and structured data enhancement. Average traffic per page increased by 2.3× even though average volume per keyword was lower. Revenue per page increased by 4.1×.
I’m not claiming this is universal. This was a single affiliate-adjacent content site in a specific niche where I have operational visibility. The finding aligns with the structural arguments in this article, but your mileage will vary by category, domain authority, and content type.
Related Reading
→ Content Quality Audit: How to Evaluate What You Already Have → Best SEO Tools for Content Evaluation in 2026 → SERP Feature Guide: How to Capture Rich Results → AI Overview Optimization: How to Get Cited → Content Scoring Framework for SEO Writers
FAQ
Should I always prioritize lower keyword difficulty over higher search volume?
No. Low KD tells you incumbents are weak on backlinks — it says nothing about whether the keyword’s traffic is accessible or commercially valuable. A KD 25 informational keyword with heavy AI Overview coverage may deliver fewer visits than a KD 55 commercial keyword with a clean, click-through SERP. Evaluate intent and SERP features before comparing difficulty or volume.
How do I know if a keyword has a high zero-click rate without checking every SERP?
Use Semrush or Ahrefs SERP features filters to identify which of your target keywords trigger AI Overviews, featured snippets, and knowledge panels. As a rule of thumb: pure definitional, fact-based informational queries (especially those answering “what is X”) have very high zero-click rates. Questions with an exact, short answer are almost always captured by SERP features. Commercial, comparison, and transactional queries retain substantially more clicks.
Why do Ahrefs and Semrush show such different KD scores for the same keyword?
They use fundamentally different formulas. Ahrefs KD is based almost entirely on the number of referring domains pointing to the current top-10 pages. Semrush uses a multi-factor formula incorporating domain authority scores, dofollow/nofollow link ratios, SERP feature presence, and search volume. Semrush scores typically run 15–25 points higher for the same keyword. Keytomic’s 2026 analysis documents this divergence clearly. The practical lesson: pick one tool and use it consistently for benchmarking. Cross-tool comparison is an analytical dead end.
Is targeting keywords for AI Overview citation actually worth the effort if there are almost no clicks?
For pure traffic goals: usually not. The click rate on AI Overview source citations is approximately 1% according to Pew Research (July 2025). However, Seer Interactive’s 2025 data shows brands cited in AI Overviews earn 35% more organic clicks and 91% more paid clicks than non-cited competitors on the same query — suggesting citation exposure drives branded search lift and trust that converts downstream. For brand authority building and multi-channel pipelines: yes, citation optimization is worth it. For pure pageview monetization: the math rarely works.
What search volume is actually worth targeting for a new content site in 2026?
This question can only be answered through the VSR model, not a raw number. A 200 searches/month commercial keyword with SOR 0.6 and CVR 3% can be more valuable than a 5,000/month informational keyword with SOR 0.12 and CVR 0.3%. For new sites without authority, start by identifying topics where you can realistically win a featured snippet or rich result within 6 months — those are often in the 200–2,000 monthly search range with KD under 30 (Ahrefs). Volume below 100/month is typically not worth standalone content investment unless it’s part of a programmatic pattern at scale.
How much weight should I put on keyword difficulty when evaluating competitor opportunities?
Use it as a relative comparison within the same tool, not as an absolute threshold. If a competitor with similar domain authority to yours consistently ranks for KD 50–60 keywords, that signals a topical authority advantage worth investigating — not a sign to dismiss those keywords as unattainable. The more useful competitive signal is: look at the referring domain count and quality of their top-ranking pages directly. What Ahrefs shows as the actual link profile of position-1 competitors tells you more than any KD summary score.
Has Google’s AI Mode changed keyword research fundamentally?
SparkToro data from early 2026 shows Google’s AI Mode is still in limited adoption — only 0.34% of searches transitioned into AI Mode during the January–April study period. But Google confirmed at I/O 2026 that AI Mode has surpassed 1 billion monthly users with query volume more than doubling each quarter. The structural shift is real; its impact on keyword traffic modeling is still emerging. For now: treat AI Mode as an amplified version of AI Overview dynamics (93% zero-click vs 83%), and plan for its expansion to affect informational keywords most aggressively through 2026–2027.
The binary — volume versus difficulty — was always a simplification. In 2026, it’s an actively harmful one. Volume measures potential. KD approximates entry cost. Neither tells you how much of that potential survives Google’s increasingly aggressive on-SERP resolution of queries before a user ever clicks through to your website.
The framework that works: start with intent category and SERP Ownership Rate to determine whether a keyword’s traffic is actually accessible. Then estimate realistic click pools using the VSR model. Then — and only then — use KD to gauge how long it will take to capture that traffic and whether the time investment is justified by the revenue potential. KD is the final input, not the first.
The SEO job in 2026 isn’t to rank — it’s to ensure that ranking still means something. That answer lives in the SERP, not in a difficulty score.